Pages

Friday, 8 June 2018

Tech - Pewter Casting - Term 2 - Week 2


For tech this week Pewter Casting group have started to print, trace and cut their Pewter design. Before we did all these steps we were to fill a google document which had a couple of designs that we could use. Also we were to give four people (it could be anyone), four design. For each design we need to have a small explanation. After that we were to show it to Sir. (Mr Grundy) Then he would print it and give us the next instruction. the following step was tracing. For this step we were to put a skinny block of wood under the paper and trace our design. After that we got to the fun part which was cutting. For this step we were to carefully cut the inside of our design. Unfortunately I wasn't able to pour in the melted pewter due to the inauspicious time. Hopeful next time I would be able to do that.

Wednesday, 6 June 2018

Maths: Fractions Extension


This week for maths, as an extension to our main task, we were also asked to in addition with solving a problem about cinema attendance, to solve a problem about how many students there are in a classroom, and the amount of people of specific ages. This was a really exciting activity, as it sounded like a real challenge. For this task, I worked with Sanujan, and we finished this in a relatively small amount of time. All of our work can be explained in the DLO.

Cinema Attendance by Age Groups

Today for maths, we were to start and complete two different tasks. The first task was about Cinema Attendance by age group. For this task we were to find a partner or work individually to solve a few questions. So I've decided to work with Jack Before we could start reading the questions we were to have a look at the line graph that had the age group attendances. As far as I know there are about 8 question to be solved with the answers. Once we were done with answering these questions, we were asked to write at least 2 paragraphs arguing why younger people are visiting the cinema a lot more than the start of the cinema's times. The paragraphs will be at the very bottom of this post. 

Here Is The Line Graph
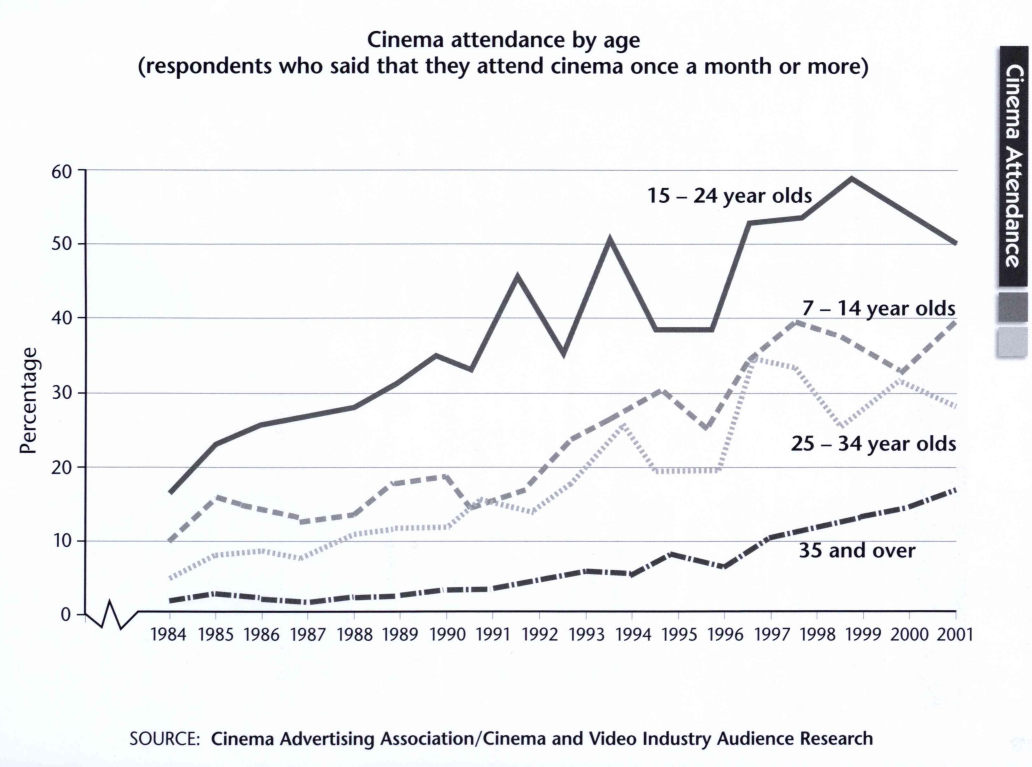


Here Are The Questions And The Answers

Question 1 : What are scales and axes?
Answer : Axes are the two lines which are used to show the amount of data on the U and X axes
                  Scales are lines to show your statistics.

Question 2 :  Is the data discrete or continuous?
Answer : The data is continuous, as it can be measure for as long at time goes.

Question 3 : Which age is most likely / unlikely to go the cinema? - Why?
Answer :
Most Likely
               15 - 24 year old are most likely because of the pattern shown on the graph which shows that
               that 15 - 24 year old attendance rises and rises after time.
               However, 7 - 14 year olds are rising up in numbers near the very end of the line graph, meaning                    that there is the potential for 7 -14 to just make it to the top.

               Most Unlikely

               25 - 34 year olds, as well as 36 year olds and older seem to be both the lowest in the chart.
               the reason as to why they have been put together, is that we think that a few years after the chart                  ends, that they would have met around the same numbers.

Question 4 : IN which year was attendance the highest for 25 - 34 year olds?
Answer : IN between 1996 and 1997.

Question 5 : What happened in 1992 and 1994 with 15 - 24 year old attendance?
Answer : That the attendances have dropped ecstatically.

Question 6 : What would we predict the cinema admission for 2005 to be?
Answer :

                15 - 24 year olds - 54 percent
               
                 7 - 14 year olds - 51 percent

                 25 - 35 year olds - 38 percent

                35 year old and over - 24 percent

Question 7 : How else could this data be displayed?
Answer : Bar Graph.

Question 8 : What newspaper headline could you use for an article based on younger kids visiting the cinema                    more.
Answer : The Youngsters Have Struck Back!

The Paragraphs -


Tuesday, 5 June 2018

Inquiry - Making The Human Body

For inquiry our task was to play a game about the bone structure of a human body. So as a fun activity for this, we were asked to play a small game where you would match all the bones together to make the human body. The best score that you could get was 26, so if you had to move bones more than 26 times, you wouldn't get a perfect score. I played the game a few times, and finally I managed to get a perfect score. I am looking forward to playing another game similar to this.

Friday, 1 June 2018

Poetry: Charlotte Anne DLO - Balled Poem

This week for poetry, our task was to answer a few questions about the poem  The Waitakere Ballads about Charlotte Anne. A women who didn't take anything from other people in the 1870's. She was one of the little women that wore jeans, as everyone knew that women were meant to wear large dresses. This was a group task, so I worked with Jack, Mele, and Marieta. Although as an extra task, we also were asked to create a DLO that showed how life was like in the 1870's. For this task we were to use our smart searching skills. These DLO's can be found on the last slide of the presentation. We all had a lot of fun with this task, and enjoyed working together as a group.

Thursday, 31 May 2018

Inquiry: Ruler Reflexes

This week for inquiry, we learnt about human reactions. We had a small challenge that included simply a ruler, a partner, and our reactions. Our task was to attempt to grab a ruler as fast as possible. We were given 3 different reactions to test. Visual, where we had to grab the ruler just by watching it. No count down, go or anything. Next was aural, where we had to close our eyes, and where only told "GO" for when we could attempt to grab the ruler. No countdown, no looking, no touching, just a simple go. Finally, was touch. We closed our eyes, no words, just a tap on the shoulder letting us know when to grab. The partner that I was given was John, and we had a lot of fun working together. What we needed to do next was graph our data. Although to make it even better, we were to group up with another pair and graph all of our data in one big graph. So for this, we chose to work with Jack and Tiava. We had a lot of fun all working together, and in the end, made a pretty great graph.

Hypothesis

Sanujan - I think that I would be best at test 1 because my eyes send messages to my brain fast.

John - I think that I could be good at test 2 because I think that I am great at listening.


(Test 1)

Sanujan
John
1
24.5
16.5
2
11.8
24.1
3
0
29.7
Total
66.3
60.7


(Test 2)

Sanujan
John
1
12.6
11.4
2
12.8
0
3
27.8
15.8
Total
53.2
57.2


(Test 3)


Sanujan
John
1
10.4
13.7
2
18.6
11.9
3
13.6
21.4
Total
42.6
47