Here Is The Line Graph
Here Are The Questions And The Answers
Question 1 : What are scales and axes?
Answer : Axes are the two lines which are used to show the amount of data on the U and X axes
Scales are lines to show your statistics.
Question 2 : Is the data discrete or continuous?
Answer : The data is continuous, as it can be measure for as long at time goes.
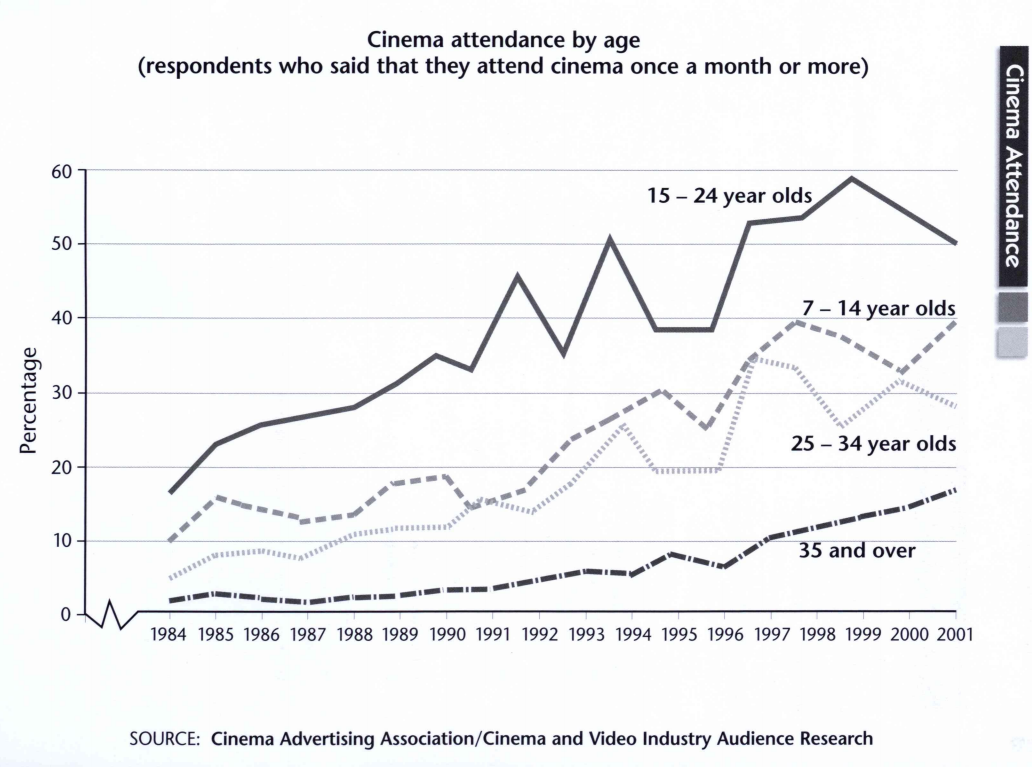
Question 3 : Which age is most likely / unlikely to go the cinema? - Why?
Answer :
Most Likely
15 - 24 year old are most likely because of the pattern shown on the graph which shows thatthat 15 - 24 year old attendance rises and rises after time.
However, 7 - 14 year olds are rising up in numbers near the very end of the line graph, meaning that there is the potential for 7 -14 to just make it to the top.
Most Unlikely
25 - 34 year olds, as well as 36 year olds and older seem to be both the lowest in the chart.
the reason as to why they have been put together, is that we think that a few years after the chart ends, that they would have met around the same numbers.
Question 4 : IN which year was attendance the highest for 25 - 34 year olds?
Answer : IN between 1996 and 1997.
Question 5 : What happened in 1992 and 1994 with 15 - 24 year old attendance?
Answer : That the attendances have dropped ecstatically.
Question 6 : What would we predict the cinema admission for 2005 to be?
Answer :
15 - 24 year olds - 54 percent
7 - 14 year olds - 51 percent
25 - 35 year olds - 38 percent
35 year old and over - 24 percent
Question 7 : How else could this data be displayed?
Answer : Bar Graph.
Question 8 : What newspaper headline could you use for an article based on younger kids visiting the cinema more.
Answer : The Youngsters Have Struck Back!
The Paragraphs -

No comments:
Post a Comment